I am playing with ThinkScript code on ThinkOrSwim platform. Specifically running this tool on MacOSX. I am wondering if there is a way to debug ThinkScript like you attach a debugger and step through the script line by line.
2 Answers
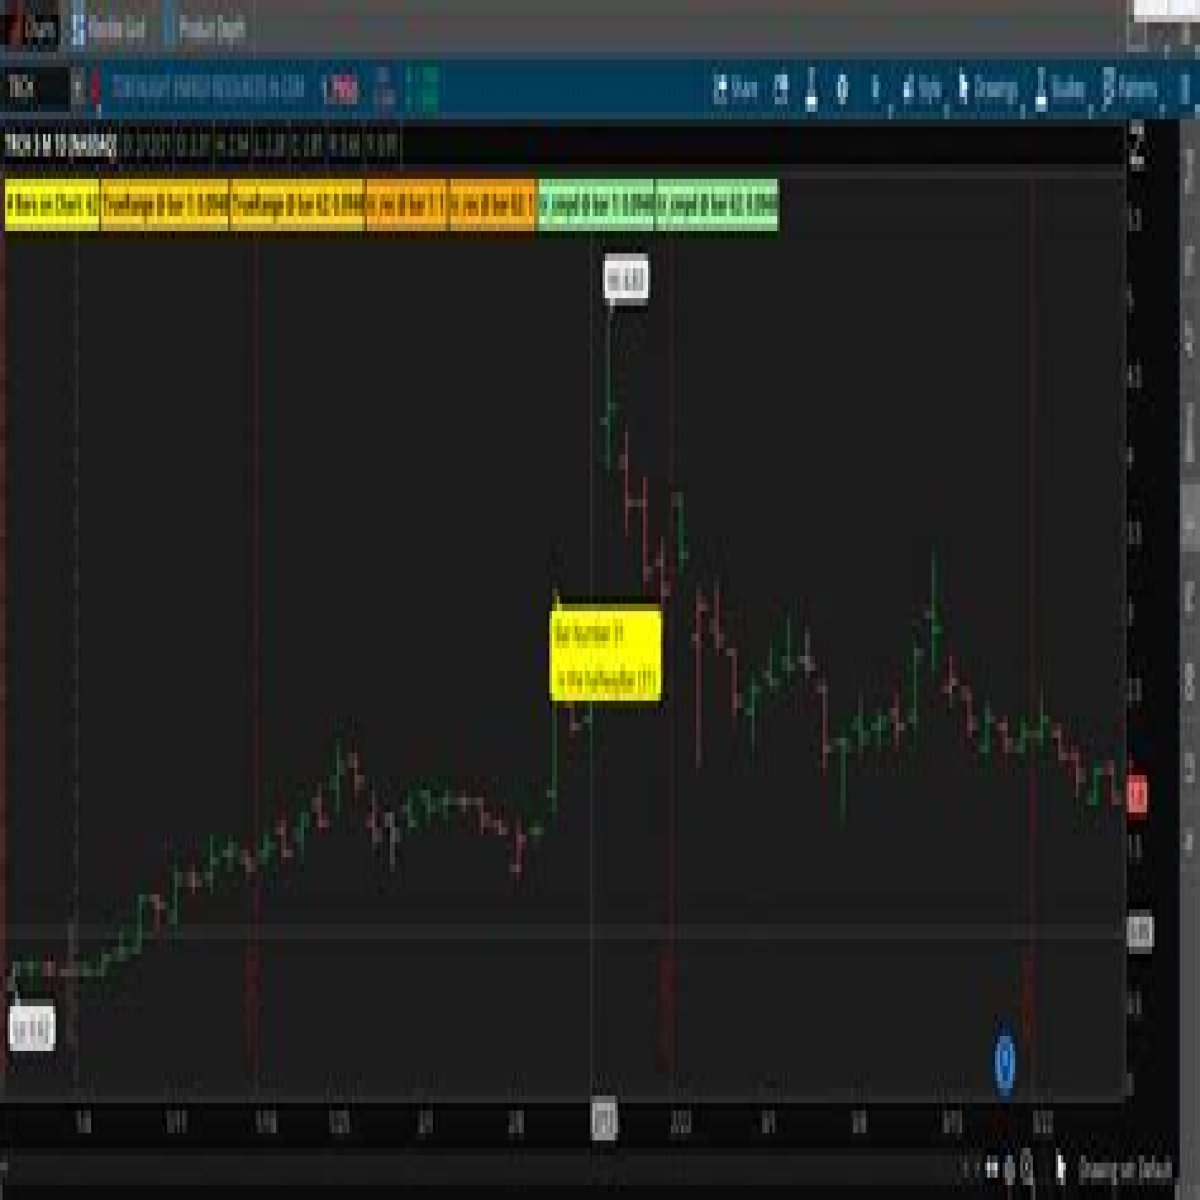
As noted by @Gary, thinkScript has no debugger tool. You can use chart bubbles, as Gary suggested, and chart labels.
Chart bubbles appear at a specified bar when a condition is met. Chart labels appear at the upper left of the chart when a condition is met.
Syntax
Notes:
- Parameter labels with spaces require double quotes; those without spaces don't require quotes.
- Parameter labels are NOT required when all required parameters are provided, and those parameters are in the expected order. I am showing them in this syntax description for clarity.
- Parameters DO NOT have to appear on individual lines. Again, I've done that in this syntax description for clarity, and so I can comment the parameters' meanings.
AddChartBubble("time condition", # condition defining bar where bubble should appear
               "price location", # which price should bubble point at (eg, high, low)
               text,             # text to display in bubble
               color,            # bubble color
               up                # display bubble above price (yes) or below it (no)
);
AddLabel(visible,  # condition defining whether the label should appear; yes means always
         text,     # text to display in label
         color     # label color
);
As a side note, #hint: .... displays a "helper" message for the code when you click the question mark in the selection list. Also, \n in the hint text places a "newline" character at that point.
Example code:
#hint: Counts a value using an if statement, recursive variable type statement, and a CompoundValue statement.\nDemonstrates using chart bubbles and labels for debugging.

def TrueRange;
if BarNumber() == 1 {
    TrueRange = ATR(14)[1];
} else {
    TrueRange = TrueRange[1];
}

def tr_rec = if BarNumber() == 1 then tr_rec[1] + 1 else tr_rec[1];

def tr_cmpd = CompoundValue(1, if BarNumber() == 1 then ATR(14)[1] else tr_cmpd[1], Double.NaN);

# plot Data = close; # not req'd if doing only labels and/or bubbles

def numBars = HighestAll(BarNumber());
def halfwayBar = numBars / 2;

# bubble to test a value
AddChartBubble("time condition"=BarNumber() == halfwayBar,
               "price location"=high,
               text="Bar Number " + BarNumber() + "\n is the halfwayBar (" + halfwayBar + ")",
               color=Color.YELLOW,
               up=no);

# labels to test values
AddLabel(yes, "# Bars on Chart: " + numBars, Color.YELLOW);

AddLabel(yes, "TrueRange @ bar 1: " + GetValue(TrueRange, numBars - 1), Color.ORANGE);
AddLabel(yes, "TrueRange @ bar " + numBars + ": " + TrueRange, Color.ORANGE);

AddLabel(yes, "tr_rec @ bar 1: " + GetValue(tr_rec, numBars - 1), Color.LIGHT_ORANGE);
AddLabel(yes, "tr_rec @ bar " + numBars + ": " + tr_rec, Color.LIGHT_ORANGE);

AddLabel(yes, "tr_cmpd @ bar 1: " + GetValue(tr_cmpd, numBars - 1), Color.LIGHT_GREEN);
AddLabel(yes, "tr_cmpd @ bar " + numBars + ": " + tr_cmpd, Color.LIGHT_GREEN);
There is no built-in debugger. However, while writing a custom study, you can use the addchartbubble() function to display variables’ values at each bar.
